Google Analytics Setup Guide
One of the first tasks for a new website is to set up Google Analytics. After all the time and effort you invested in building a website, you want to measure and analyse the user behavior of course. You may have questions like:
- How is my content performing?
- which product category is the most popular?
- How many conversions did my Facebook campaign trigger?
- Do visitors actually watch the video I produced?
- Are there any pages that perform particularly bad?
- Do visitors share anything on social media?
- Do people drop out during the checkout process?
All assumptions about user behaviour as well as campaign performance must be validated. 55% of all websites on the internet use Google Analytics to do that. In fact, it has a market share of 84% in the traffic analysis tool market, so you don't have to worry that you are choosing the wrong analytics tool.
A web analytics tool enables you to make decisions based on data instead of guessing. Such decisions can be for example about what type of content to invest in or how much budget you should spend on ad campaigns.
Therefore it is of essential importance to set up Google Analytics professionally, so you track the right KPIs for your analysis. With such a setup in place, you'll have plenty of metrics available to dive into.
Types of Google Analytics setups
The type of website is a key factor for a Google Analytics setup:
Are you running an online shop or sell products?
Then e-commerce analytics is the way to go. It is more product- and transaction-oriented and will give you helpful insights you don't want to miss.
If you run a content-focused site about your brand, then a typical Google Analytics tracking setup is the right fit.
You can track user interactions with event tracking and oversee important website KPIs with Google Analytics goals.
E-commerce analytics setups require more data about products and transactions. That's why the configuration is a bit more complex, involving custom JavaScript to build a so-called data layer.
A data layer is essentially a store of data, that holds information about each page. Google Analytics will then recognize and use it, when available.
Don’t worry for now if you realize, you need to set up Google Analytics for an e-commerce site. You can activate e-commerce functionality later on and also enhance the data layer, once you are prepared to do so.
Until then, e-commerce reports will stay blank, but other reports will work just fine.
Where to get the Google Analytics Tracking Code?
Visit analytics.google.com and click the Signup button to create a Google Analytics account. You'll get the Google Analytics tracking code, once you follow below steps.
- After you click the signup button, click further and choose a property name and URL followed by your industry and time zone.
- I recommend deselecting all data sharing options, if you are not fully on top of your privacy policy. But that means Google will not share audience demographics and interest reports with you.
If you want to use those reports, you may have to update your privacy policy. This is to inform users you are sharing data about their browsing behavior with Google. - After you finish, you receive your Google Analytics tracking ID (e.g. UA-141112345-1). Along with it, you will receive the code snippet to put into the source code of all of your pages.
How to implement Google Analytics?
There are generally two ways to implement a Google Analytics:
- You paste the Google Analytics tracking code into the source code of all pages. You can do this page by page or you paste it into a common template file. That could be the header, navigation or footer that all pages have in common.
I don’t recommend this way of implementing Google Analytics, unless you want to do it quick and easy and never touch the analytics setup again.
Most tracking setups are done faster and easier with a tag management system. It is an easier and also more flexible process, so it is worth to introduce yet another tool into the stack. - You use a tag management system, like Google Tag Manager, which is pretty popular.
There are other alternatives like Adobe Launch, Tealium, Ensighten or Matomo (open source), too.
Generally, they all serve the same purpose and are very similar. You can implement Google Analytics with a non-Google tag management system without worry. Google Tag Manager just happens to be the one that everybody can easily get access to and has the most resources available online.
If you want to learn more about it, check out my Google Tag Manager tutorial.
How to implement Google Analytics with Google Tag Manager?
As for the implementation of Google Analytics via Google Tag Manager, follow these steps:
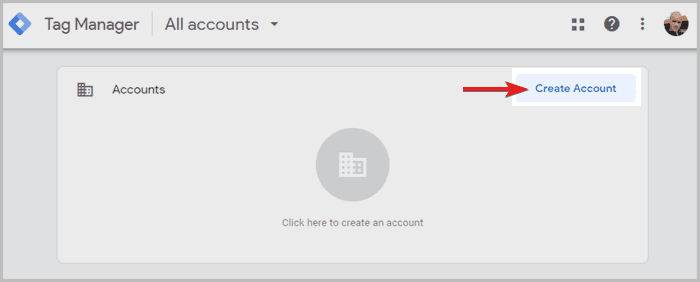
- Visit tagmanager.google.com and create an account.
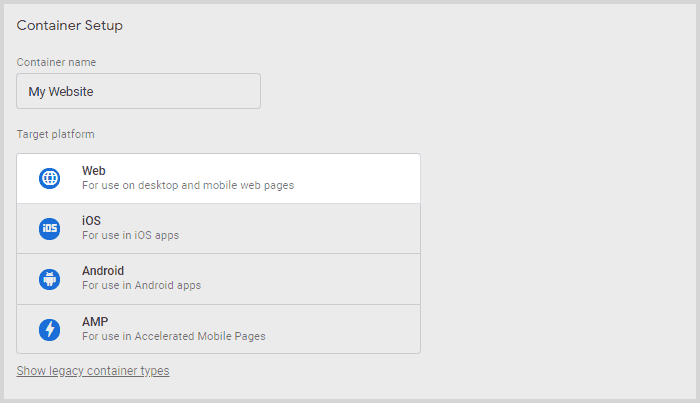
- With the account you will create a container for your website, so make sure to select Web for its usage:
afterwards, you will receive the Google Tag Manager code snippet for implementation:
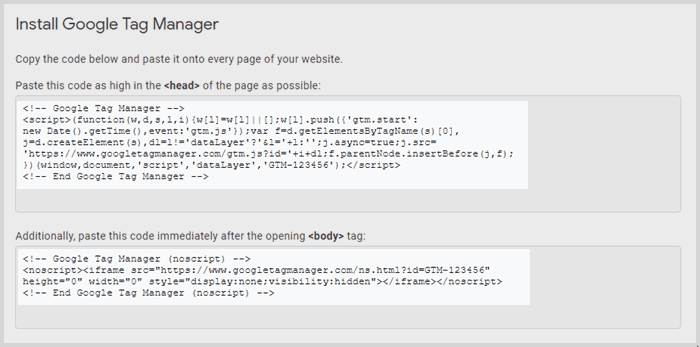
Add the first part to the <head> tag on all pages of your website. The other part is added inside the <body> tag.
After the Google Tag Manager (GTM) snippet is added, the analytics setup can be configured in a breeze!
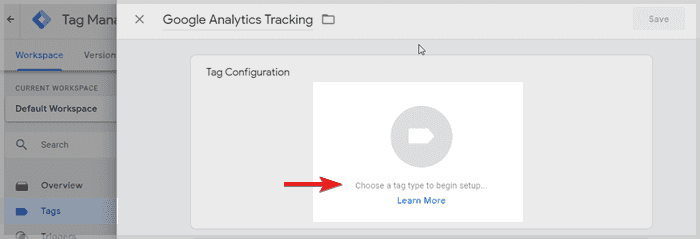
- In GTM, click on tags in the left navigation and add a new tag. An overlay will slide in from the side and you can give the tag a name, e.g. Google Analytics Tracking.
- Then click on the tag configuration box:
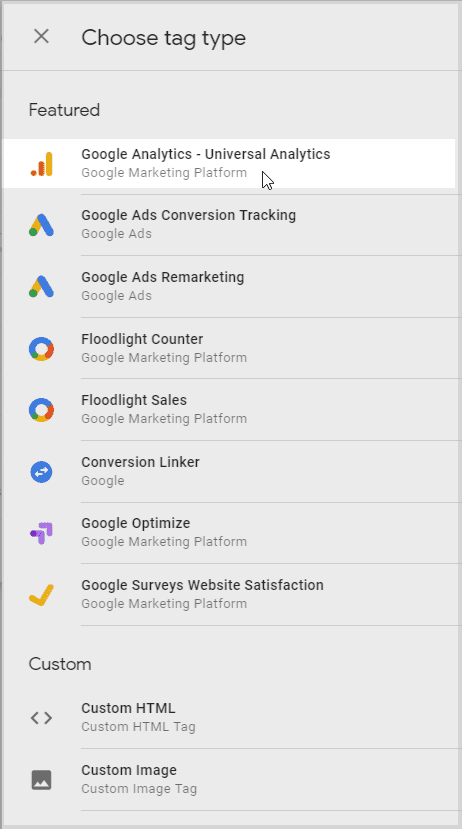
- A list with tag types will slide into the screen.
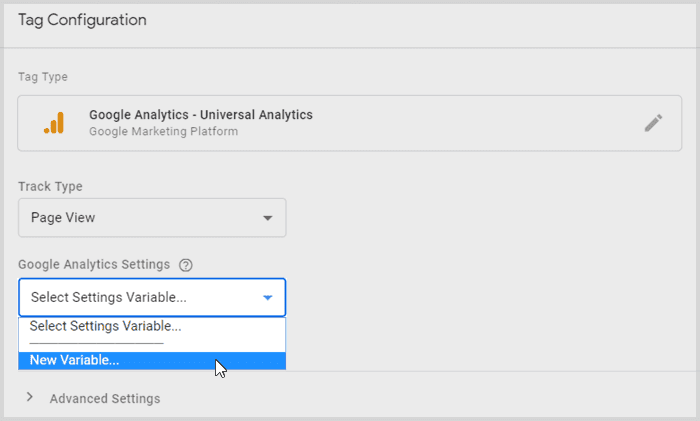
Select the Google Analytics - Universal Analytics tag and start the configuration. - Keep the Track Type to be Pageview.
- Then create a new Google Analytics settings variable.
- To configure the settings variable, you first give it a name. Right after, paste in the Google Analytics Tracking ID (UA-141112345-1), that you received earlier.
- Click save.
- Back in the tag configuration, click the triggering section to choose a trigger.
- Select all pages, because we want the Google Analytics code snippet to run on all pages.
- Save the trigger as well as the tag configuration and get back to the Google Tag Manager overview.
- Hit the blue submit button in the top right corner. Give your first container version a name and click on publish.
Now you have successfully implemented Google Analytics with Google Tag Manager!
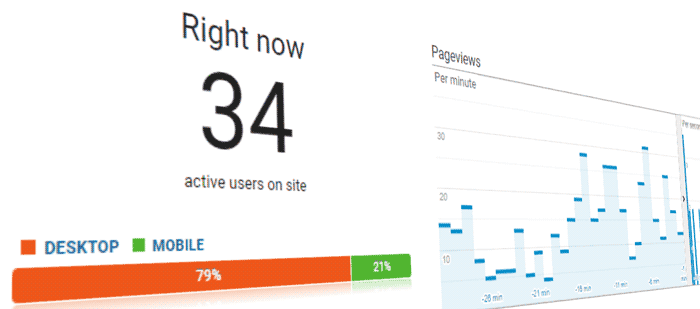
You should see data coming into your Google Analytics property after about an hour or so.
You can also have a look at the real-time report to see if there is already some data coming in from your current visit.
Notice you could implement other tools or scripts and trigger them on all pages, in just a few minutes?
I hope this makes you realize the ease and power of a tag management system.
How to set up goals in Google Analytics?
Now that you are receiving visitor data, it is time to set up Google Analytics goals.
Chances are, you are selling something on your website or there is a form that people can fill out.
Normally, after an order, users land on a thank you page. It usually says thank you for the order and lists up some order details.
Look into the address bar and see what URL that page has.
For example, it could look like this:
https://www.yoursite.com/thank-you.php
Let’s set up a goal for this address and count how often this page is visited to indicate how many orders took place.
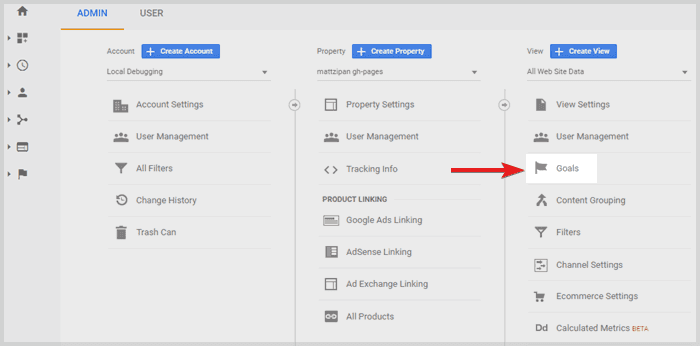
- Go to the Google Analytics admin area with an overview of your account, property and view. Click goals within the view section.
- Add a new goal and select custom in the goal setup. Then continue.
- Give your goal a name, for example Newsletter subscription or Order form received and select the type to be a destination. Then continue.
- Under destination is equal to, add the URL path, so in our example:
You can also get nifty and select Regular Expression as the match type in the dropdown menu./thank-you.php
If you don’t know what regular expressions are: They are a powerful and handy way of matching strings. Here you can learn how to use them in an hour or two: RegexOne - You can optionally assign a value to your goal. I would recommend it, if you can assign a numeric value to each of those thank-you pageviews.
There are multiple ways to do this. The easiest is, to look at the monthly revenue from those thank-you pages and divide it by the total number of pageviews.
That will give you the average for each time the goal hit. - Set up a funnel if the user journey is supposed to hit some specific pages before the conversion. This makes a lot of sense for forms that are split up across multiple steps. You can check later if a proportion of visitors falls out of the funnel somewhere during the process.
You can add steps to the funnel by giving each step a name and a page path (see below).
Note that, if you chose equal to in the upper destination dropdown, you have to use the same match type for your funnel rules.
Or if you chose regular expressions, you have to follow regex syntax in your page matching rules. - Before saving, click on verify goal.
If you already have some data in your GA property, it will run through it and check for matches in the historical data.
If you have zero matches, but know there must be some, you likely made a mistake specifying the page paths.
So, this is a good place to double-check the rules are working, before you finish the goal setup.
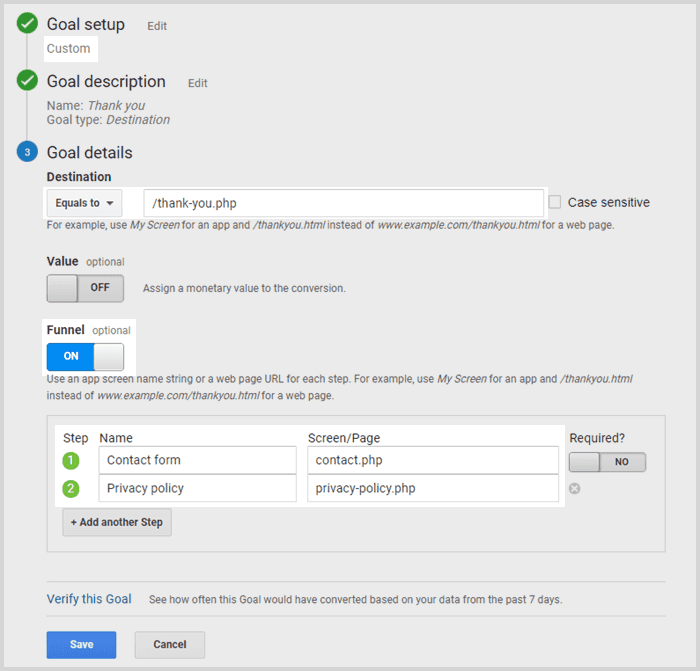
Congratulations! You just set up your goal and can track goal conversions going forward!
Goals should be set up for the most important conversions of your website. If other conversions are less critical or maybe they are not represented with their own page path, you can set up a Google Analytics events.
After setting up an event you can use it to base your goal conversions on it.
Set up events in Google Analytics
The process of setting up events in Google Analytics can look very different for each event. Depending on the interaction and website's technology, there are different steps to take. Below you can find a list of different event tracking examples.
Examples for event tracking
- sharing your content on social media
- playing the video on your front page
- hitting the back button to the Google Search Results
- scrolling down to the bottom of your article
- clicking on your contact email
- adding a product to the shopping basket
- selecting a color variation of a product
The procedure for setting up scroll tracking is different than for tracking mouse clicks. On dynamic websites, HTML elements are not always visible. Hence, click tracking would require a different approach, than on static websites.
The point is, there are many influencing factors, so I wrote a separate event tracking article. There I go into detail, step by step, and explain how to track button clicks or other elements. Have a look at it here:
Event tracking in Google Analytics
Set up campaign tracking in Google Analytics
Campaign tracking is already built into every Google Analytics Setup. You just have to add UTM parameters to the links in your email or social media campaigns.
There are five parameters that you can add to any link pointing to your website. The built-in Google Analytics campaign tracking recognizes a user from such a link. It then attributes the visit to the specified campaign and you can find it in the campaign report.
Let's take the URL https://www.yoursite.com/campaign
and the following campaign tracking parameters as an example:
| UTM Parameter | Parameter value |
|---|---|
| UTM Source | Medium |
| UTM Medium | Guest post |
| UTM Campaign | Spring sales |
| UTM Term | Boots |
| UTM Content | Boots when it’s warm outside |
This is the same URL including UTM parameters:
https://www.yoursite.com/campaign?UTM_source=medium&UTM_medium=guest-post&UTM_campaign=spring-sales&UTM_term=boots&UTM_content=boots-when-its-warm-outside
You can use it on social media or on other sources that link to your site. Google Analytics tracks automatically how many clicks reach you from such a link.
Notice the five UTM parameters in the URL? You don't have to add those manually. There are UTM Builder tools that do that for you. You just give them the link to your website and values for the UTM parameters. Afterwards, they'll give you the campaign tracking link, including all UTM parameters, back.
Google Analytics Best Practices
Below is a list of additional best practices for setting up Google Analytics. I apply each one vigorously for each GA setup I configure. They are not just nice to have, but rather necessary to maximize data quality.
Filters can be set up in the tag management system too. In fact, I prefer it, because JavaScript allows for more advanced rules when filtering. Nevertheless, filters in Google Analytics are simpler and get the job done almost as well.
Exclude own traffic from Google Analytics
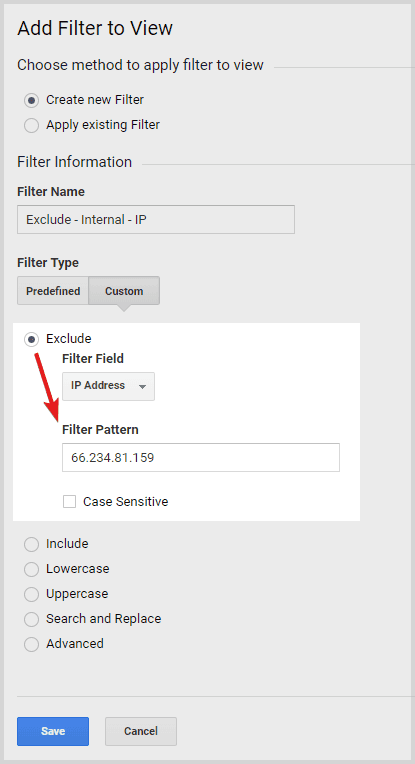
Now that you are tracking visits, exclude your own sessions from your website traffic. Your browsing behavior will differ from regular users and otherwise skew your data. This counts especially for low traffic pages, since own pageviews weigh in heavier overall.
To exclude your own traffic you can filter yourself out by IP address, if you have a static IP.
If not, you may want to consider to get one from your internet provider, since they don't cost much usually.
- To set up IP exclusion in Google Analytics, go to the Admin panel and click on Filters within the view column on the right.
- Add a name for your filter and select the filter type to be custom.
- Choose the exclude filter option and select IP Address in the dropdown.
- Then enter your static IP into the filter pattern field and click save.
Transform page paths to lowercase
Another tweak is to automatically transform your page path to lowercase.
Humans make mistakes and at some stage, somebody will create a URL with capital letters in its name. If the website then returns the same content, as for the same URL with lower case letters, things get messy.
Let me explain.
We are essentially sending data under two different page paths, though the data is for the same page.
Page paths written in varying cases lead to messy analysis in Google Analytics. Any unique writing of the same path will be shown on its own row in the reports. After a while, you end up looking at multiple rows and their metrics, even though they should be combined.
If you then also earn backlinks to the same page, but the address in the link was written in a funny way, the mess is perfect. So let's try to keep our life drama-free and fix this beforehand.
- To transform URL paths to lowercase visit the Filters for your view again and add a new filter. Give it a name and select the custom filter type.
- Now choose Lowercase and select Request URI in the field dropdown.
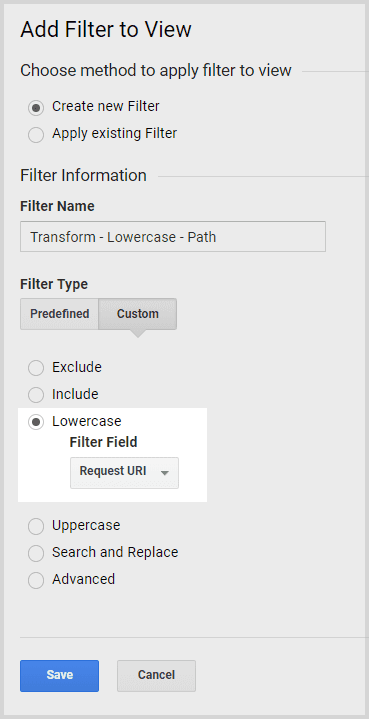
- Click save to finish. Easy fix, that saves many headaches.
Google Analytics View Structure
A view is where you access all your Google Analytics reports. If there are filters set up for your view, all reports will be filtered accordingly.
Your view structure should usually mimic your organization’s structure. If your target markets are e.g. rather regional than country-based, set up your views the same way. It will come in handy when KPIs for regions, are directly accessible.
Another orientation is your organization’s structure for budgeting and marketing efforts. If it is done on a country level, it’s probably a good idea to follow that structure for the views too.
You can create up to 25 views per property. So, depending on the number of markets and marketing channels, several view structures are possible.Example: Google Analytics view structure for local websites
1.0 Master
2.0 Internal traffic
3.0 Raw dataOne way or another, there are usually 3 types of views. They could be filtered down further by country or device, if it makes sense for your organization.
Example: Google Analytics view structure for multinational websites
1.1 Master (US)
1.2 Master (UK)
1.3 Master (DE)
1.4 Master (FR)
1.5 Master (ES)
1.6 Master (MX)
1.7 Master (RUS)
2.0 Internal Traffic
3.0 Raw DataExample: Google Analytics regional view structure
1.0 Master (NA)
1.1 Master (EMEA)
1.2 Master (LATAM)
1.3 Master (APEC)
2.0 Internal Traffic
3.0 Raw DataThe Master view is the primary view for analysis and excludes all internal traffic.
The Internal traffic view includes all internal traffic. This one can be used for debugging and testing purposes too. If you set the include filter, anything else will be excluded automatically.
In the beginning, Google Analytics creates a first All Web Site Data view, together with the GA property.
Keep it, but change the name to Raw Data. You want to have a raw data view without any filters. You cannot undo a filter retroactively and look at the unfiltered data. Therefore, it is a best practice to keep one view untouched. To change the name, go to Admin > View > View Settings.
In most cases, companies are focusing their efforts on one or a few countries. In that case, create views on a per-country basis and set filters accordingly.
You can also create views per traffic source (organic, paid, direct, social, etc.) or device (desktop, tablet, mobile). I use Google Analytics segments for that, but there is no reason to not filter the specifics already in the view. I like to keep the number of views low though because it keeps the GA user interface clean.
I may get a bit messier with segments in the view then and apply remaining specifics there.Create all views as early as possible, because they only show data from the moment they were created. A new view will not show any historical data from before the creation date. If you need to look back in history with specific filters, you fall back on the raw data view. You just apply the intended filters with segments instead. This way you get your insight, but don’t alter the data.
TIP: If some views share the same filters, you can create one and then duplicate it along with all filters. Afterwards, you just add any view-specific filters to the duplicates.
Make sure to keep the original view unchanged though, so you only add filters to the duplicates. Messing with the original view later on, will affect the duplicated views too.Google Analytics Alerts
Another best practice is to set up Google Analytics alerts. I set it up to get notified for decreases in sessions or when the server response time goes up. This way I can look into the reasons and potentially do something.
- To set up an alert in Google Analytics, visit Customization in the side menu.
- Alternatively, you can also visit the Admin area again and click on Custom Alerts in the view panel.
- click Custom Alerts and click manage customized alerts
- Configuring a Google Analytics alert for decreasing sessions is pretty simple. Click New Alert and name the alert for example Session decrease with the Period set to Week.
- Also, check the box to receive an email when the alert triggers.
- There are usually traffic fluctuations between weekdays, weekends and national holidays. We don’t want to be alerted for those fluctuations, so we set it up to look at weekly session data.
- The Alert Conditions apply to all traffic and you want to be alerted when sessions decrease by more than 35% compared to the previous week.
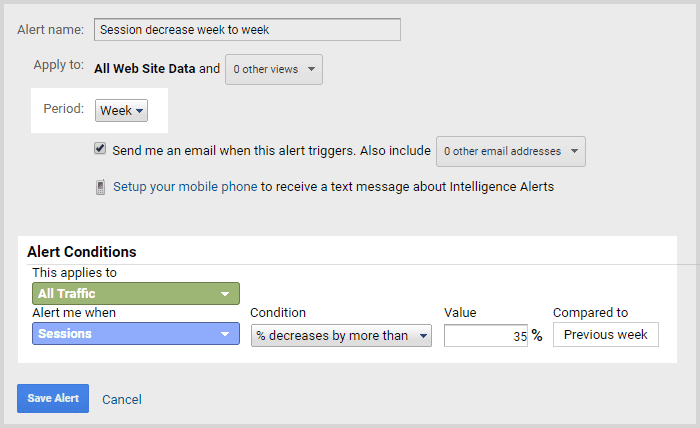
Afterwards, hit save and let’s add the next alert.
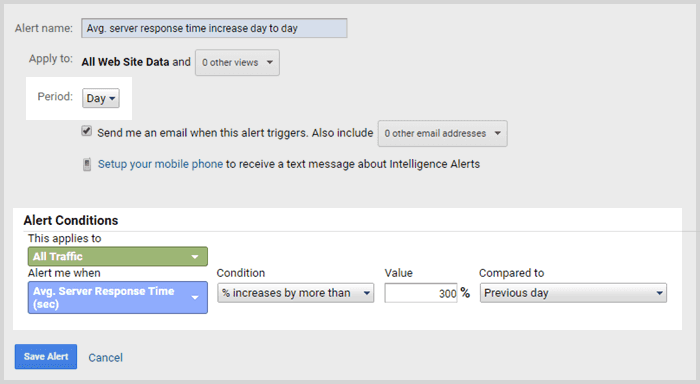
To set up a Google Analytics alert for an increasing server response time,
- click on New Alert and give it a name, like Avg. server response time increase day to day and
- select day as the period.
- For the alert conditions, it applies to all traffic and you want to be alerted when your avg. server response time increases by more than 300% compared to the previous day:
Afterwards, hit save.
Now you can be sure to receive an alert email when your traffic drops down or when your server is having problems.